MySQL 5.7 InnoDB Temporary Tablespace – but why?

So, recently we had a runaway query eat up all sorts of temporary table space on our machines. Several machines had several terabytes in their ibtmp1 file after this happened. So I set out to find out more about why the InnoDB temporary tablespace is used, why it is better than using regular files, which was what was used prior to MySQL 5.7, and how to make sure that runaway queries do not end up filling up disk space.

Unfortunately, the manual does not go into why ibtmp1 is better than one file per temporary query, which disappears once the query ends. There are a few sections to look into:

Temporary Table Undo Logs – has one paragraph that states that these are the undo logs for temporary tablespaces. Given that these are undo logs, my guess is that this makes MySQL more crash-safe. But that is just a guess.

There is also InnoDB Temporary Tablespace which is two paragraphs, with some more details, but again, no reasoning why.

And finally, the documentation for the innodb_temp_data_file_path system variable sheds a bit of light on the subject – It explains “Metadata about active InnoDB temporary tables is located in INFORMATION_SCHEMA.INNODB_TEMP_TABLE_INFO.”

There is a manual page on Innodb temp table info table as well, which shows both compressed and uncompressed tables – uncompressed tables live in the ibtmp tablespaces, and compressed temporary tables live in the .ibd tablespace of the compressed table in question – as shown in the “PER_TABLE_SPACE” and “IS_COMPRESSED” fields.

Sadly, the table does not give useful information such as which process ID or user is generating the data. And of course it is only the active temporary space usage at the time – if you have a large temporary tablespace but no active queries using the tablespace, INNODB_TEMP_TABLE_INFO is empty.

I can imagine a scenario with more than one long-running query using a lot of space in the temporary tablespace. But I do not see how the INNODB_TEMP_TABLE_INFO would help me determine any useful information as to which query I should kill. I guess it is useful to see if there is an active query currently using temporary tablespace, but when you have a large file with nothing in it, it is just that much more depressing.

# mysql INFORMATION_SCHEMA -p -e “SELECT * FROM INNODB_TEMP_TABLE_INFO”
Enter password:
# ls -rlth /var/lib/mysql/ibtmp1
-rw-r—– 1 mysql mysql 2.3T Oct 31 10:50 /var/lib/mysql/ibtmp1

Lesson 07: Advanced MySQL Querying

Notes/errata/updates for Chapter 7:
See the official book errata at http://tahaghoghi.com/LearningMySQL/errata.php – Chapter 7 includes pages 223 – 275.

Supplemental blog post – ORDER BY NULL – read the blog post and the comments!

GROUP BY and HAVING examples – Supplemental blog post. The example of HAVING in the text shows a use case where HAVING is the same function as WHERE. This blog posts shows examples of HAVING that you cannot do any other way.

In the section called “The GROUP BY clause”, on pages 231-232, the book says:
“you can count any column in a group, and you’ll get the same answer, so COUNT(artist_name) is the same as COUNT(*) or COUNT(artist_id).” This is not 100% true; COUNT does not count NULL values, so if you had 10 rows and 1 artist_name was NULL, COUNT(artist_name) would return 9 instead of 10. COUNT(*) counts the number of rows and would always return 10, so COUNT(*) is preferable when you intend to count the number of rows.

Also in that section, on page 233 when they show you the example:
SELECT * FROM track GROUP BY artist_id;
– Note that they explain the result is not meaningful. In most other database systems, this query would not be allowed.

In the “Advanced Joins” section, specifically on page 238 at the bottom where they say “There’s no real advantage or disadvantage in using an ON or a WHERE clause; it’s just a matter of taste.” While that’s true for the MySQL parser, it’s much easier for humans to read, and see if you missed a join condition, if you put the join conditions in an ON clause.

In the section on Nested Queries, on page 251, it says “nested queries are hard to optimize, and so they’re almost always slower to run than the unnested alternative.” MySQL has gotten better and better at optimizing nested queries, so this statement isn’t necessarily true any more.

A “derived table”, is a nested query in the FROM Clause, as described in the section heading with that name (p. 262).

In the “Table Types” subsection (p. 267), it says that MyISAM is a good choice for storage engines, and that “you very rarely need to make any other choice in small-to medium-size applications”. However, it’s recommended to use InnoDB for better concurrency, transaction support and being safer from data corruption in a crash situation. Indeed, the default storage engine in more recent versions of MySQL is InnoDB.

In addition, the lingo has been changed since the book was written; we now use “storage engine” instead of “table type”. The examples that use CREATE TABLE or ALTER TABLE with TYPE may need to be changed to STORAGE ENGINE instead of TYPE.

Finally, you can skip the section on BDB since it has been deprecated (p. 274-5).

Topics covered:
Aliases
Join style
Joins (JOIN, INNER, COMMA, STRAIGHT, RIGHT, LEFT, NATURAL)
UNION and UNION ALL
Data aggregation (DISTINCT, GROUP BY, HAVING
Subqueries and Nested Queries (including ANY, SOME, ALL, IN, NOT IN, EXISTS, NOT EXISTS, correlated subqueries, derived tables, row subqueries)
User Variables
Transactions/locking
Table Types/Storage engines

Reference/Quick Links for MySQL Marinate

MySQL Marinate – So you want to learn MySQL! – START HERE

Want to learn or refresh yourself on MySQL? MySQL Marinate is the FREE virtual self-study group is for you!

MySQL Marinate quick links if you know what it is all about.

This is for beginners – If you have no experience with MySQL, or if you are a developer that wants to learn how to administer MySQL, or an administrator that wants to learn how to query MySQL, this course is what you want. If you are not a beginner, you will likely still learn some nuances, and it will be easy and fast to do. If you have absolutely zero experience with MySQL, this is perfect for you. The first few chapters walk you through getting and installing MySQL, so all you need is a computer and the book.

The format of a virtual self-study group is as follows:
Each participant acquires the same textbook (Learning MySQL, the “butterfly O’Reilly book”, published 2007). You can acquire the textbook however you want (e.g. from the libary or from a friend, hard copy or online). Yes, the book is old, but SQL dates back to at least the 1970’s and the basics haven’t changed! There are notes and errata for each chapter so you will have updated information. The book looks like this:

O'Reilly Butterfly book picture
O’Reilly Butterfly book picture

Each participant commits to reading each chapter (we suggest one chapter per week as a good deadline), complete the exercises and post a link to the completed work.

Each participant obtains assistance by posting questions to the comments on a particular chapter.

Note: There is no classroom instruction.

How do I get started?

– Watch sheeri.com each week for the chapters to be posted.

– Get Learning MySQL
Acquire a book (the only item that may cost money). Simply acquire Learning MySQL – see if your local library has it, if someone is selling their copy, or buy it new.

– Start!
When your book arrives, start your virtual learning by reading one chapter per week. Complete the exercises; if you have any questions, comments or want to learn more in-depth, that’s what the comments for!

FAQs:
Q: Does this cover the Percona patch set or MariaDB forks?

A: This covers the basics of MySQL, which are applicable to Percona’s patched MySQL or MariaDB builds, as well as newer versions of MySQL.

Q: What do I need in order to complete the course?

A: All you need is the book and access to a computer, preferably one that you have control over. Windows, Mac OS X or Unix/Linux will work. A Chromebook or tablet is not recommended for this course.

Q: Where can I put completed assignments?

A: Completed assignments get uploaded to github. See How to Submit Homework

Q: The book was published in 2007. Isn’t that a bit old?

A: Yes! The basics are still accurate, and we will let you know what in the book is outdated. I have contacted O’Reilly, offering to produce a new edition, and they are not interested in updating the book. We will also have optional supplemental material (blog posts, videos, slides) for those who want to learn more right away. We are confident that this self-study course will make you ready to dive into other, more advanced material.

Soak it in!

Reference/Quick Links for MySQL Marinate

Cost/Benefit Analysis of a MySQL Index

We all know that if we add a MySQL index to speed up a read, we end up making writes slower. How often do we do the analysis to look at how much more work is done?

Recently, a developer came to me and wanted to add an index to a very large table (hundreds of gigabytes) to speed up a query. We did some testing on a moderately used server:

Set long_query_time to 0 and turn slow query logging on
Turn slow query logging off after 30 minutes.

Add the index (was on a single field)

Repeat the slow query logging for 30 minutes at a similar time frame (in our case, we did middle of the day usage on a Tuesday and Wednesday, when the database is heavily used).

Then I looked at the write analysis – there were no DELETEs, no UPDATEs that updated the indexed field, and no UPDATEs that used the indexed field in the filtering. There were only INSERTs, and with the help of pt-query-digest, here’s what I found:

INSERT analysis:
Query hash 0xFD7…..
Count: 2627 before, 2093 after
Exec time:
– avg – 299us before, 369us after (70us slower)
– 95% – 445 us before, 596us after
– median – 273us before, 301us after

I extrapolated the average per query to 2400 queries, and got:
**Total, based on 2400 queries – 71.76ms before, 88.56ms after, 16.8ms longer**

There was only one read query that used the indexed field for ORDER BY (or anywhere at all!), so the read analysis was also simple:

Read analysis:
Query hash 0xF94……
Count:187 before, 131 after
Exec time:
– avg – 9ms before, 8ms after. 1 ms saved
– 95% – 20ms before, 16 ms after
– median – 9ms before, 8 ms after

Again, extrapolating to average for 150 queries:
**Total, based on 150 queries: 150ms saved**

So we can see in this case, the index created a delay of 16.8 ms in a half-hour timeframe, but saved 150 ms in reads.

It is also impressive that the write index added very little time – 70 microseconds – but saved so much time – 1 millisecond – that there were 16 times the number of writes than reads, but we still had huge improvement, especially given the cost.

I cannot make a blanket statement, that this kind of index will always have this kind of profile – very tiny write cost for a very large read savings – but I am glad I did this analysis and would love to do it more in the future, to see what the real costs and savings are.

Query Reviews (part 2): pt-query-digest

Query reviews (part 1): Overview

The 1st post in the series gave an overview of what a query review is and the value they can bring you. So now let’s talk about how one is done, specifically, how to do a query review using pt-query-digest.

The point of a query review is that it is a comprehensive review of queries. Imagine if you could get a list of all queries that run on your system, and then you systematically looked at each query to determine if it is optimized. That is the basic concept behind a query review.

So, how do you get a list of queries?

pt-query-digest can use a slow query log, binary log, general log or tcpdump. I usually use a slow query log with long_query_time set to 0, so I can capture all the successful queries and their timings. If this is too much overhead, consider using Percona Server’s log_slow_rate_limit and log_slow_rate_type parameters to only log every nth session/query. This means that if you have 5000 queries per second, you can set the slow logging rate to every 100th query, and reduce the write overhead for the slow query log to 50 queries per second (instead of all 5000 queries).

So you have your log, now what? Well, we need to process it. The –type option is where you set what your log type is (binlog, genlog, slowlog, tcpdump). Default is slowlog.

By default, pt-query-digest will give you a report of the top 95% worst queries. You can change that with the –limit parameter – note that –limit just limits the output; pt-query-digest still processes all the queries in the log file. If –limit is followed by an integer, it will limit the output to the top X queries; if it’s followed by a percentage (e.g. 10%) it will output the top percentage of queries.

As this is a query review of all queries, we will want to set the limit to 100%.

There are a lot of other options that pt-query-digest has, but many of them are there so we can distill and get queries that meet a certain criteria. The point of a query review is to look at ALL queries, so we do not need to use those options.

In fact, the only other options we need are related to the review itself. Because a review is systematic, we need a place to store information related to the review. How about a database for that? In fact, pt-query-digest has a –review option that takes parameters to store the information into a table.

Here is the command I recently used to start a query review. It was run from the shell commandline, and I used –no-report because I did not want anything other than the table and its rows created:
[sheeri.cabral@localhost]$ pt-query-digest --no-report --type slowlog --limit 100% --review h=localhost,u=sheeri.cabral,D=test,t=query_review --create-review-table --ask-pass mysql_slow.log

You can see that –review has a number of arguments, comma-separated, to identify a table on a host to put the queries into. I used the –create-review-table flag to create the table, since it did not already exist, and –ask-pass because I do not type in passwords in a shell command.

pt-query-digest then spends some time analyzing the file then creating and populating the table. Here’s a sample row in the table:

*************************** 1. row ***************************
checksum: 11038208160389475830
fingerprint: show global status like ?
sample: show global status like ‘innodb_deadlocks’
first_seen: 2017-06-03 11:20:59
last_seen: 2017-06-03 11:32:15
reviewed_by: NULL
reviewed_on: NULL
comments: NULL

The checksum and fingerprint are ways to make the query portable, no matter what values are used. The fingerprint takes out all the differences among iterations of the query, and puts ? in its place. So if you have a query that’s used over and over, like
SELECT first_name FROM customers WHERE id in (1,2,3)
the fingerprint would look like
SELECT first_name FROM customers WHERE id in (?+)

The sample provides a way for us to copy and paste into an EXPLAIN (or my favorite, EXPLAIN FORMAT=JSON) statement, so that we can assess the query.

So then we can go through the process of optimizing the query. In the end, this query has nothing to tweak to optimize, so I update the reviewed_on date, the reviewed_by person, and the comments:

mysql> UPDATE test.query_review set reviewed_on=NOW(), reviewed_by='sheeri.cabral', comments='no mechanism to optimize' WHERE checksum=11038208160389475830;
Query OK, 1 row affected (0.00 sec)
Rows matched: 1 Changed: 1 Warnings: 0

On to the next query – we shall get the next query that has not yet been reviewed:
mysql> select * from test.query_review where reviewed_on is null limit 1\G

If you have already done some query reviews, your WHERE clause may look something like where reviewed_on is null OR reviewed_on < NOW()-interval 6 month.

And then look at that query for optimization. Lather, rinse, repeat. This is a GREAT way to get familiar with how developers (and ORMs) are writing queries.

Some tricks and tips – first take a look at all the queries less than 50 characters or so – you can easily update those to be all set to reviewed, with whatever message you want.
mysql> select fingerprint from query_review where length(sample)<50;
+----------------------------------------------+
| fingerprint |
+----------------------------------------------+
| administrator command: Ping |
| set session `wait_timeout` = ? |
| show tables |
| rollback |
| select * from information_schema.processlist |
| select @@session.tx_isolation |
| show status |
| start transaction |
| select user() |
| show query_response_time |
| set autocommit=? |
| show full processlist |
| show databases |
| administrator command: Statistics |
| show plugins |
| show slave status |
| commit |
| set names ? |
| show global status like ? |
| administrator command: Quit |
| show /*!? global */ status |
| set names utf? |
| select @@version_comment limit ? |
| show engine innodb status |
| select database() |
+----------------------------------------------+
25 rows in set (0.00 sec)

One great feature is that you can add columns to the table. For example, maybe you want to add an “indexes” column to the table, and list the index or indexes used. Then after the query review is complete, you can look at all the indexes in use, and see if there is an index defined in a table that is NOT in use.

You can review all the queries and run a query review every 6 months or every year, to look at any new queries that have popped up, or queries that have been removed (note first_seen and last_seen in the table).

You can also see how the query performance changed over time using the –history flag to pt-query-digest, which can populate a table with statistics about each query. But that is a topic for another post!

Query reviews are excellent ways to look comprehensively at your queries, instead of just the “top 10” slow, locking, most frequent, etc. queries. The EXPLAINing is long and slow work but the results are worth it!

Why does the MySQL optimizer not do what I think it should?

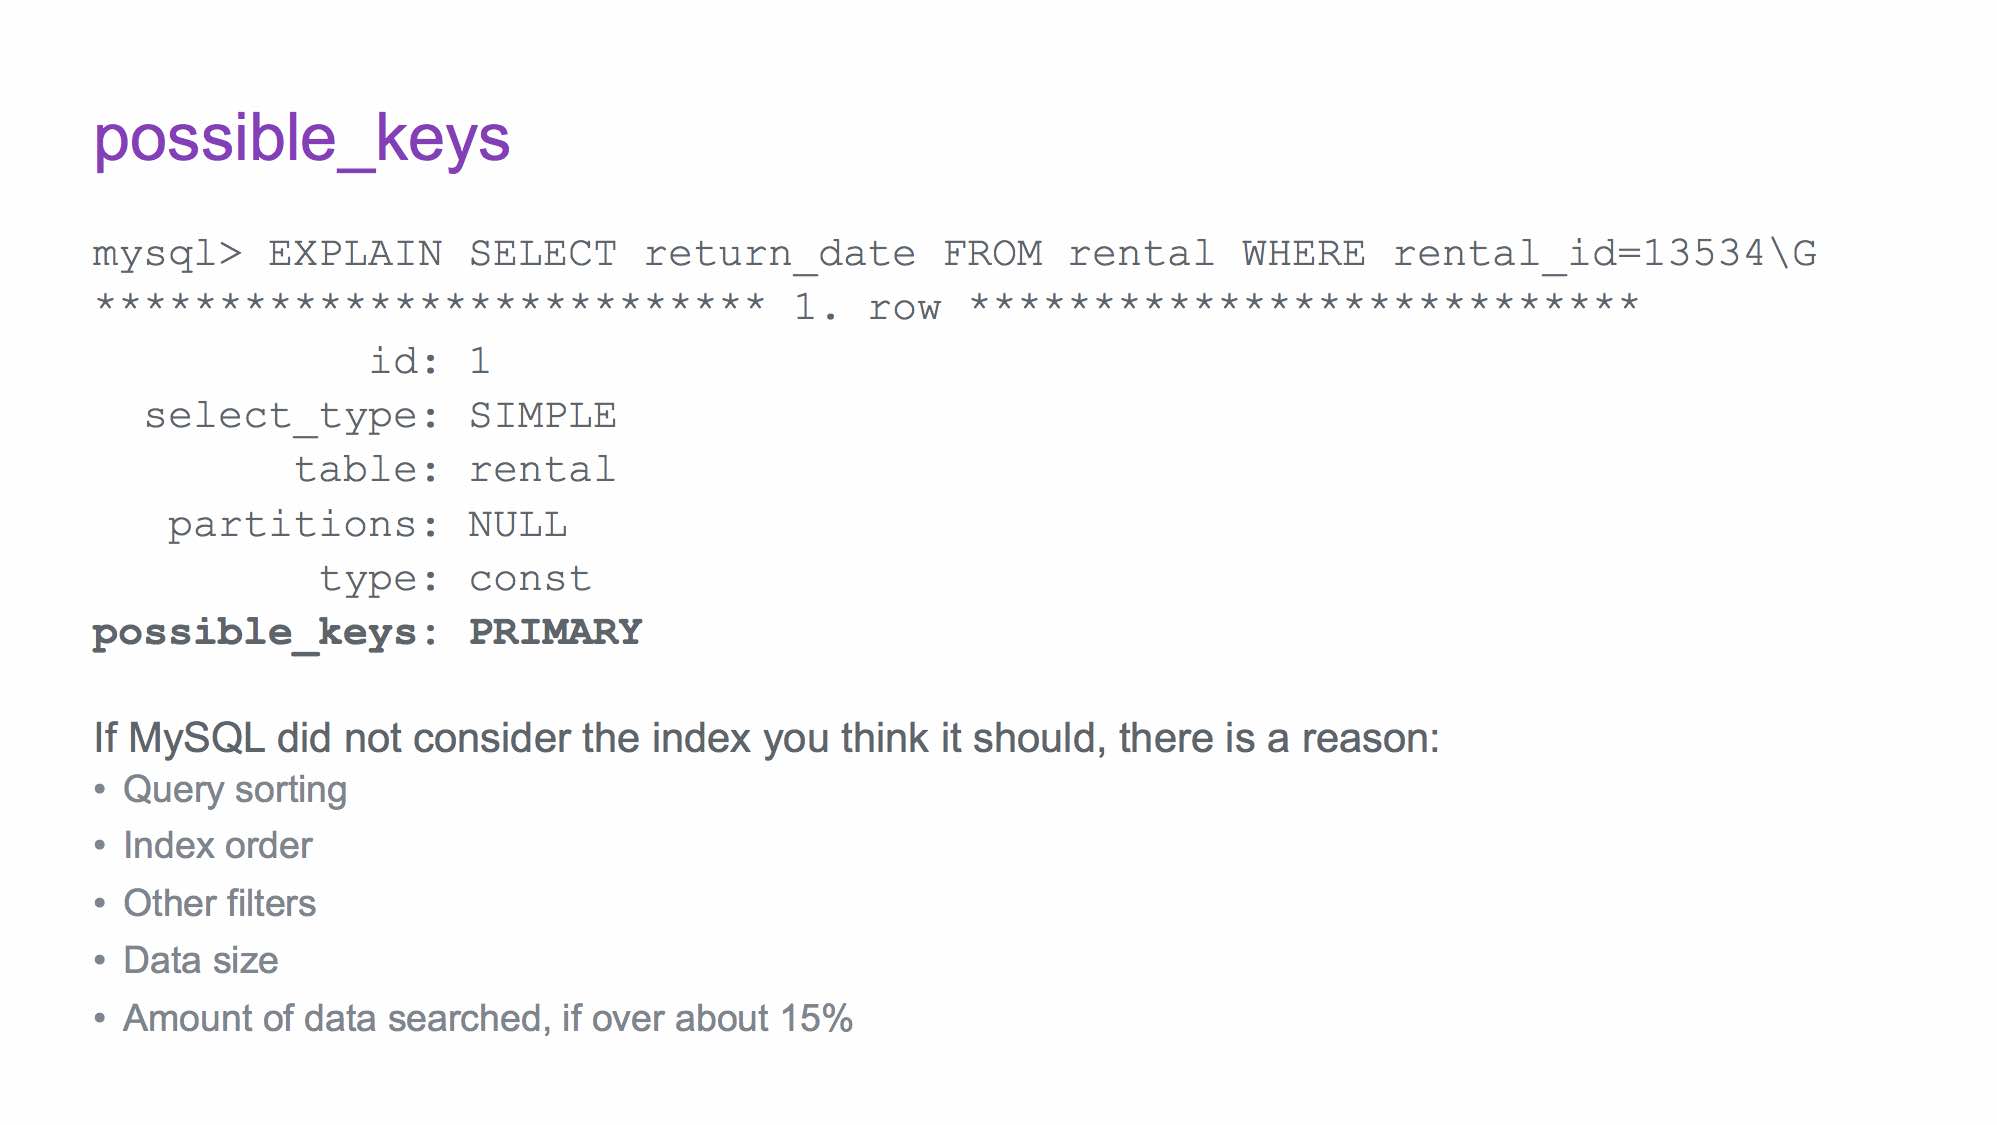
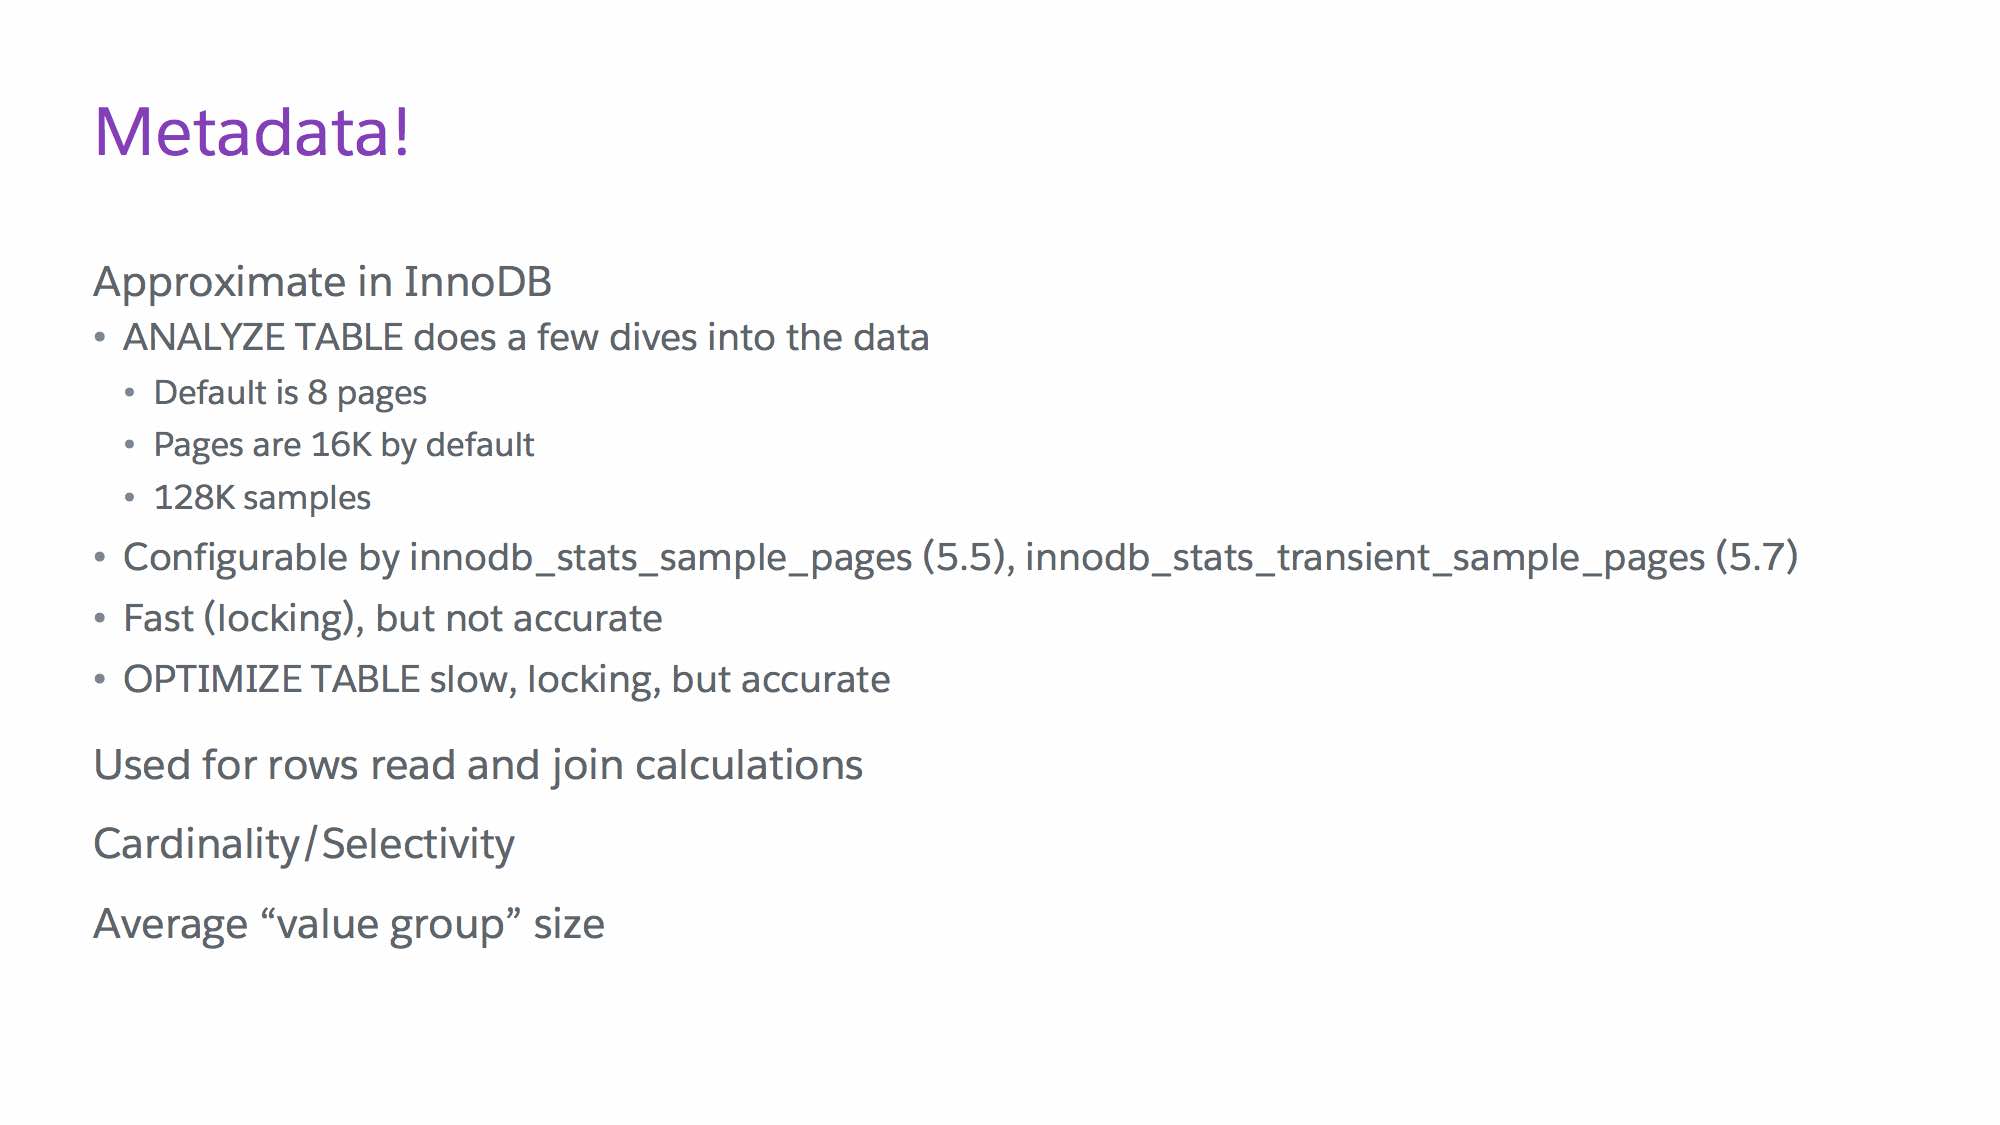
In May, I presented two talks – one called “Are you getting the best out of your indexes?” and “Optimizing Queries Using EXPLAIN”. I now have slides and video for both of them.

The first talk about indexing should probably be titled “Why is MySQL doing this?!!?!!?” It gives insight into why the MySQL optimizer chooses indexes that you do not expect; especially when it does not use an index you expect it to.

The talk has something for everyone – for beginners it explains B-trees and how they work, and for the more seasoned DBA it explains concepts like average value group size, and how the optimizer uses those concepts applied to metadata to make decisions.

Slides are at http://technocation.org/files/doc/2017_05_MySQLindexes.pdf.
Click the slide image below to go to the video at https://www.youtube.com/watch?v=e39-UfxQCCsSlide from MySQL indexing talk

The EXPLAIN talk goes through everything in EXPLAIN – both the regular and JSON formats – and describes what the fields mean, and how you can use them to figure out how to best optimize your query. There are examples that show where you can find red flags, so that when you EXPLAIN your own queries, you can be better prepared for gotchas. The EXPLAIN talk references the indexing talk in a few places (both talks were given to the same audience, about a week apart), so I highly recommend you watch that one first.

Slides are at http://technocation.org/files/doc/2017_05_EXPLAIN.pdf.
Click the slide image below to go to the video at https://www.youtube.com/watch?v=OlclCoWXplgSlide image from the EXPLAIN talk

Proactive MySQL: Query Reviews (part 1, overview)

Query Reviews part 2: pt-query-digest

One task that can really help reduce future problems is to do a periodic query review. I’ve been using pt-query-digest to do this since 2010 (back when it was part of Ma’atkit, mk-query-digest!), and while I have presented the idea several times at conferences, I have never blogged about it.

I am going to share a secret with you – I blog not just to share information with YOU, but to share information with ME. Future me. This comes up because I am working on a query review at Salesforce.com for one of our busiest shards. I went to go look up a blog post on using pt-query-digest, because it’s a handy cheat sheet….and….I never did it. So, here goes!

This is the first blog post in what will be a series of blog posts, because it is a long topic and there are a few tools that can be used these days for analysis.

What is a query review?
At its simplest, it’s a review of queries. In this context, a query review is where you proactively review the performance of ALL successful queries sent to a server.

Why should you do a query review?
A query review can find possibly problematic queries BEFORE they are a problem. As an example, you can easily find queries that do not use an index, and make indexes before the tables become so large that they have problems.

Another example is the case when you have a query that does the same thing over and over, many times per second – for example, a query that counts the sessions table every time a user hits the page, to say “x people online now”. That query could be rewritten to not do a count every time – maybe do a count once every minute or 5 minutes and put inside a “user count” table, and then each page hit queries that table. Or use an intermediate cache.

Another reason to do a query review is that sometimes a sample query is difficult to find.

Who should do a query review?
A query review is not for a junior DBA. You need to have some knowledge of how to optimize queries, how indexing works, when an index is valuable, and when an index is necessary. For example, a query not using an index on a text field in the “countries” table is much better than a query not using an index on an integer in the “customer” table, because countries won’t grow to be huge but hopefully your customers table will.

What does a query review look like?
Necessary for a query review is gathering “all” queries. This can be done in many ways:

  • general log – logs all queries when they are sent to the server
    • Pros
    • Built into all versions and forks of MySQL.
    • Gets ALL queries sent to the server, even ones that have an error. You can see if there are lots of queries with syntax errors, which can help find code/ORM bugs.
    • Gets ALL attempted logins, even if they fail, so it’s useful for a security/technical debt.
    • You can turn it on dynamically since….MySQL 5.1 (I think? at any rate, probably your version has it dynamic)
    • MySQL overhead
    • Cons
    • because the logging happens when they are sent, there is no indication if the query completed successfully, or how long the query took.
    • Write intensive to disk
    • Grows at a large rate
  • slow query log with long_query_time turned to 0 – gets all *successful* queries
    • Pros
    • Built into all versions and forks of MySQL.
    • Can be turned on dynamically (since, I think, MySQL 5.1, same as general log).
    • Gets lots of information, including lock timing, query execution timing, rows returned, whether the query was successful or not.
    • Cons
    • Does not get ALL attempted queries – only gets some errors (e.g., not syntax errors)
    • Does not get failed logins
    • Write intensive to disk
    • Grows at a large rate
    • MySQL overhead
  • tcpdump and other traffic sniffers (wireshark, built-in sniffers to programs like MONyog, etc)
    • Pros
    • Built into every platform
    • Gets all MySQL traffic, including attempted logins and queries with syntax errors
    • Gets information like execution time, users and hosts.
    • No additional MySQL overhead
    • Cons
    • Must be root to run tcpdump
    • Write intensive to disk
    • Grows at a large rate
  • PERFORMANCE_SCHEMA, pt-query-digest –processlist, proxies, audit logs

Well, that’s a lot of words for one blog post, so I’ll end part 1: overview here. Future posts in the series will cover how to use the tools to do a query review.

Indexing Talk Online

I am doing a quick blog post to announce that I have put an indexing talk online*. Most recently, I delivered this indexing talk at Confoo and Scale 11x. The talk is on YouTube at Are You Getting the Best … Continue reading

I am doing a quick blog post to announce that I have put an indexing talk online*. Most recently, I delivered this indexing talk at Confoo and Scale 11x.

The talk is on YouTube at Are You Getting the Best Out of Your MySQL Indexes? There are also PDF slides.
From the official conference description, if you want to know more:
MySQL indexes are often used to make performance better. However, they can make performance suffer if you are not using them properly. Oracle ACE Director Sheeri Cabral explains the pitfalls to avoid with indexes and how to utilize compound indexes to maximize index availability with the least amount of write overhead.

*I know I have not been posting blogs for a long time. This was a very busy year, and I took March through July off from conferences in order to buy a house and move.

What is an “unauthenticated user”?

Every so often we have a client worrying about unauthenticated users. For example, as part of the output of SHOW PROCESSLIST they will see:

+-----+----------------------+--------------------+------+---------+------+-------+------------------+
| Id  | User                 | Host               | db   | Command | Time | State | Info             |
+-----+----------------------+--------------------+------+---------+------+-------+------------------+
| 235 | unauthenticated user | 10.10.2.74:53216   | NULL | Connect | NULL | login | NULL             |
| 236 | unauthenticated user | 10.120.61.10:51721 | NULL | Connect | NULL | login | NULL             |
| 237 | user                 | localhost          | NULL | Query   | 0    | NULL  | show processlist |
+-----+----------------------+--------------------+------+---------+------+-------+------------------+

Who are these unauthenticated users, how do they get there, and why aren’t they authenticated?

The client-server handshake in MySQL is a 4-step process. Those familiar with mysql-proxy already know these steps, as there are four functions that a Lua script in mysql-proxy can override. The process is useful to know for figuring out exactly where a problem is when something breaks.
(more…)

Every so often we have a client worrying about unauthenticated users. For example, as part of the output of SHOW PROCESSLIST they will see:

+-----+----------------------+--------------------+------+---------+------+-------+------------------+
| Id  | User                 | Host               | db   | Command | Time | State | Info             |
+-----+----------------------+--------------------+------+---------+------+-------+------------------+
| 235 | unauthenticated user | 10.10.2.74:53216   | NULL | Connect | NULL | login | NULL             |
| 236 | unauthenticated user | 10.120.61.10:51721 | NULL | Connect | NULL | login | NULL             |
| 237 | user                 | localhost          | NULL | Query   | 0    | NULL  | show processlist |
+-----+----------------------+--------------------+------+---------+------+-------+------------------+

Who are these unauthenticated users, how do they get there, and why aren’t they authenticated?

The client-server handshake in MySQL is a 4-step process. Those familiar with mysql-proxy already know these steps, as there are four functions that a Lua script in mysql-proxy can override. The process is useful to know for figuring out exactly where a problem is when something breaks.

Step 1: Client sends connect request to server. There is no information here (as far as I can tell). However, it does mean that if you try to connect to a host and port of a mysqld server that is not available, you will get

ERROR 2003 (HY000): Can't connect to MySQL server on '[host]' (111)

Step 2: The server assigns a connection and sends back a handshake, which includes the server’s mysqld version, the thread id, the server host and port, the client host and port, and a “scramble buffer” (for salting authentication, I believe).

It is during Step 2 where the connections show up in SHOW PROCESSLIST. They have not been authenticated yet, but they are connected. If there are issues with authentication, connections will be stuck at this stage. Most often stuck connections are due to DNS not resolving properly, which the skip-name-resolve option will help with.

Step 3: Client sends authentication information, including the username, the password (salted and hashed) and default database to use. If the client sends an incorrect packet, or does not send authentication information within connect_timeout seconds, the server considers the connection aborted and increments its Aborted_connects status variable.

Step 4: Server sends back whether the authentication was successful or not. If the authentication was not successful, mysqld increments its Aborted_connects status variable and sends back an error message:

ERROR 1045 (28000): Access denied for user 'user'@'host' (using password: [YES/NO])

Hope this helps!

Picking Up Where You Left Off……

I started this as a response to Keith Murphy’s post at http://www.paragon-cs.com/wordpress/?p=54, but it got long, so it deserves its own post. The basic context is figuring out how not to cause duplicate information if a large INSERT statement fails before finishing.

Firstly, the surefire way to make sure there are no duplicates if you have a unique (or primary) key is to use INSERT IGNORE INTO.

Secondly, I just experimented with adding an index to an InnoDB table that had 1 million rows, and here’s what I got (please note, this is one experience only, the plural of “anecdote” is *not* “data”; also I did this in this particular order, so there may have been caching taking place):

Way #1:
– ALTER the table to add the new index. This was the slowest method, taking over 13 minutes.

Way #2:
– CREATE a new table with the same schema as the old except for adding the new index
– INSERT INTO newtable SELECT * FROM oldtable;
– ALTER TABLE oldtable RENAME somethingdifferent;
– ALTER TABLE newtable RENAME oldtable;

The ALTER TABLEs happen instantly. This was faster by a few seconds, which is statistically negligible given the 13+ minutes total time.

Way #3:
– mysqldump the table schema only (–no-data) into a file (tableschema.sql).

– mysqldump the table data only (-t) into another file (tabledata.sql).
– optionally pipe into awk to replace “^INSERT INTO” with “INSERT IGNORE INTO”

– edit the table schema file, adding the new index into the table definition
– optionally change the name of the table to something like newtable, making sure to change the DROP TABLE *and* CREATE TABLE statements.

– mysql < tableschema.sql (this will drop the old table unless you changed the name) - mysql < tabledata.sql () - If you changed the table name in the DROP and CREATE statements, run - ALTER TABLE oldtable RENAME somethingdifferent; and ALTER TABLE newtable RENAME oldtable; - Delete the "somethingdifferent" table This way took just over 10 minutes, 3 minutes faster than the other 2 ways, for a time savings of 25%. CAVEAT: MySQL helpfully moves references on a table to the new table name when you ALTER TABLE...RENAME. You will have to adjust your foreign keys, stored procedures, functions and triggers if you use anything other than Way #1. CAVEAT #2: Make sure that the character set of the MySQL server is supported by the MySQL client and the operating system where you're dumping the file to, otherwise special characters can end up falling victim to mojibake.